San Jose Real Estate Market Report: November 2020
December 27, 2019
Real Estate

December 27, 2019
Real Estate
Based on the October 2019 data, the housing markets in the South Bay counties of Santa Clara and San Mateo are a seller’s market. Santa Cruz is a neutral market.
In the following section, we’ll consider two primary housing trends: median home prices and month’s supply (a combination of sales and inventory). We’ll also examine two secondary trends: number of days on market and average sold price compared to original list price.
Let’s start by comparing median home prices for the South Bay from October 2019 with prices from October 2018. Yearly comparisons are important because they remove variations due to seasonality.
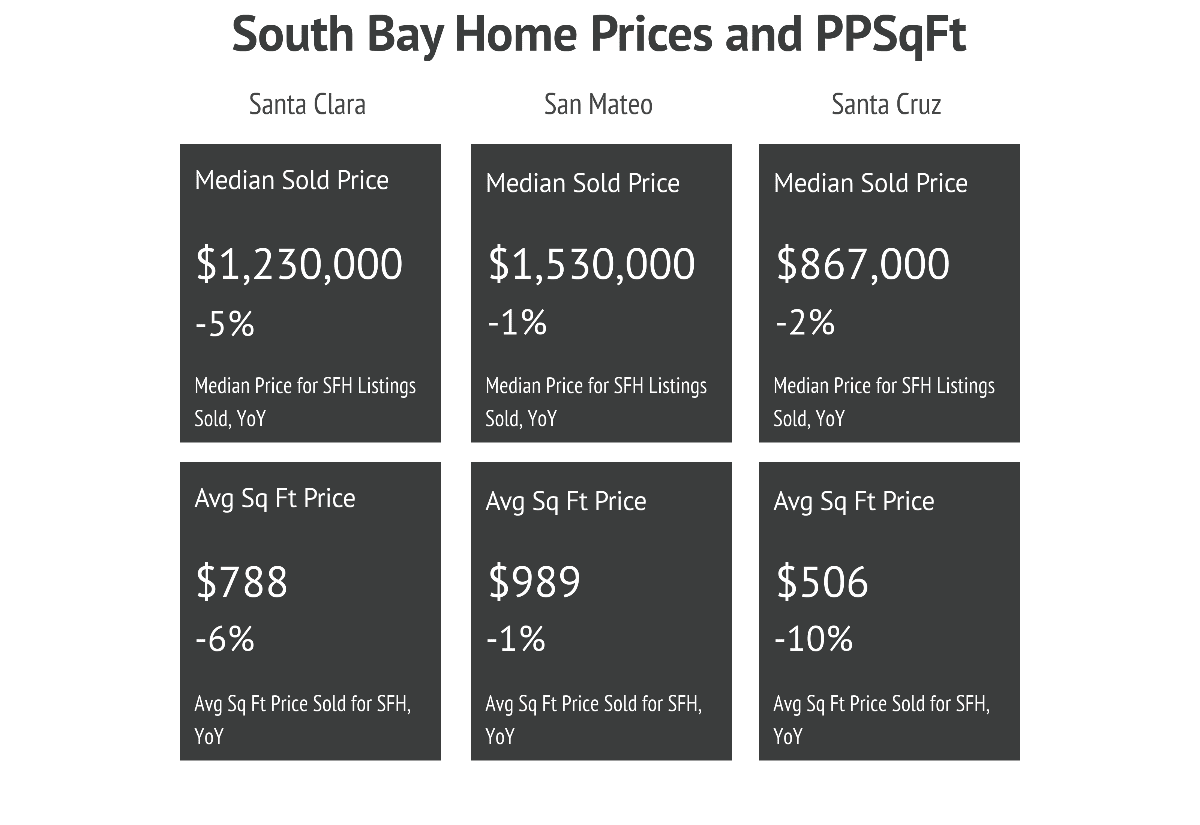
When analyzing median home prices, it’s important to take note of both the direction and the degree of price-change from the same time last year. If home prices have increased by a significant margin (10% or more), then buyers and sellers should expect home values to increase compared to past comps. Looking at single-family homes in the South Bay, all of the counties stayed within 10% of their median prices from the previous year.
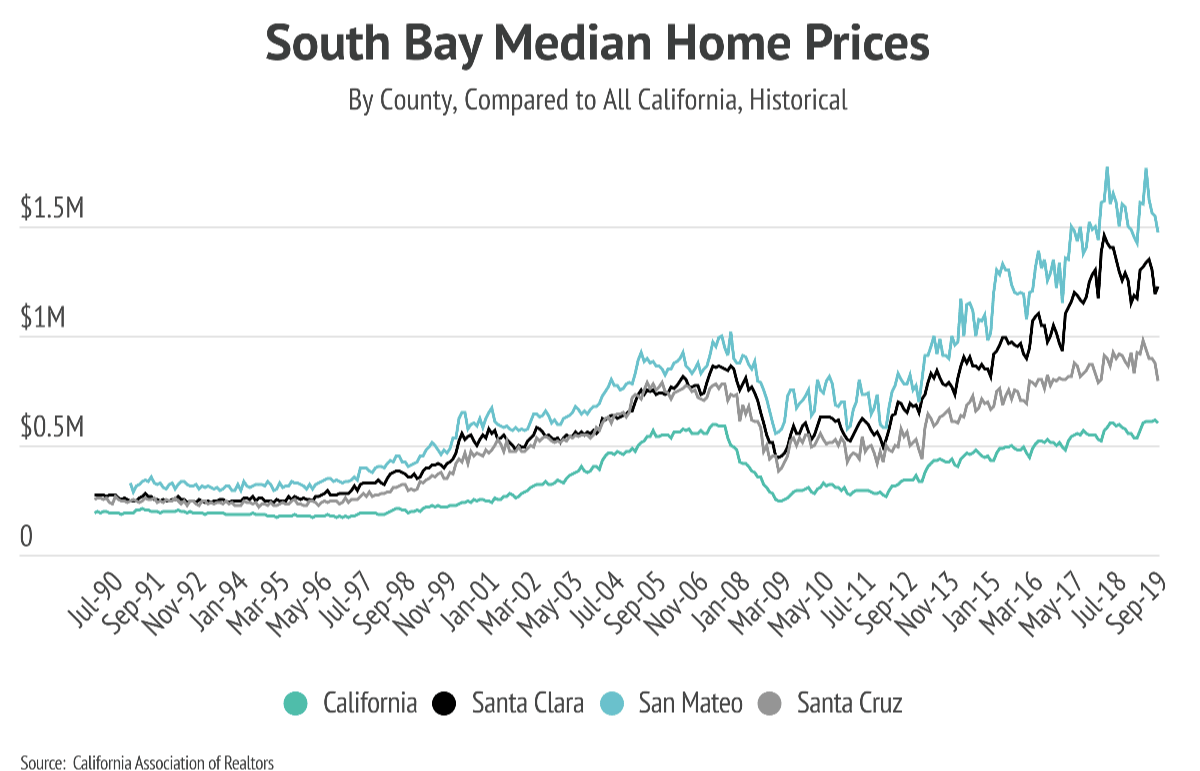
Taking a look at historical median home prices, the South Bay saw significant gains year-over-year from 2010 until the beginning of 2019. From that point on, home prices leveled off and closely tracked those of the previous year, which suggests that homes should be priced in line with their previous sold comparables.
Next, let’s examine month’s supply.
Month’s supply measures how many months it would take for all current listings on the market (including listings under contract) to sell at the current rate of sales. Nationwide, most analysts consider six months of supply to be a balanced market between buyers and sellers. A low level of supply means that there’s more buyer demand than there are homes for sale. In this environment, sellers may list their homes for more than the comps would indicate, get multiple offers, command higher prices through a bid process, and/or sell the home quickly. For a market with high supply, generally, the opposite is true.
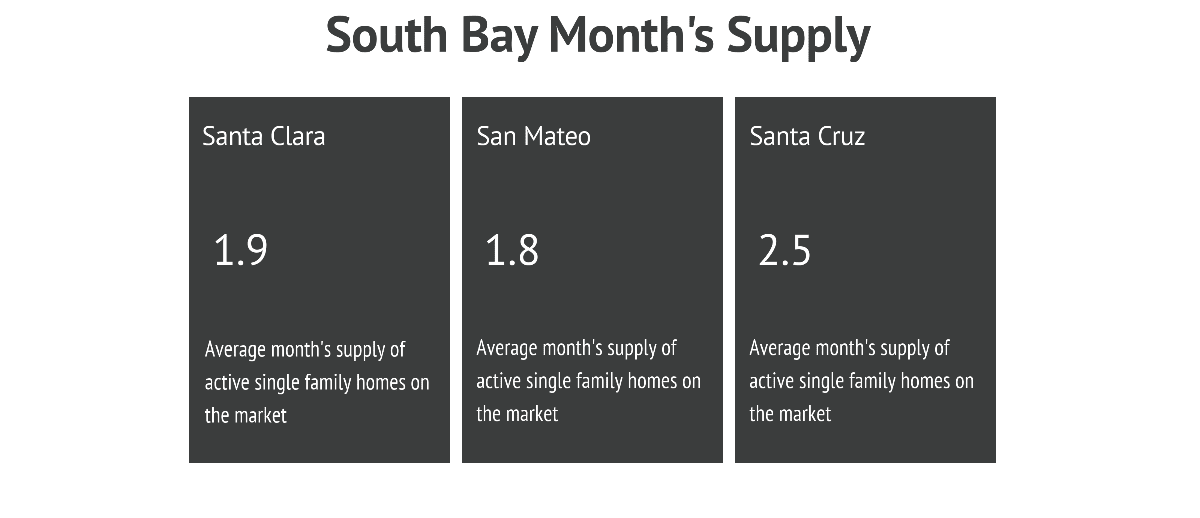
Month’s supply is well below the six-month level in many of the markets, which typically indicates a seller’s market with plenty of buyer demand. In California’s high-demand market, however, experts define “balanced” as having a much lower month’s supply. In September 2019, the supply for all of California was just 3.2 months, which, for this region, is balanced. By this measure, Santa Clara and San Mateo’s supply levels are very low.
Again, supply measures the time it would take to sell (sales) all of the current listings (inventory). We can take a closer look at those two individual factors below.
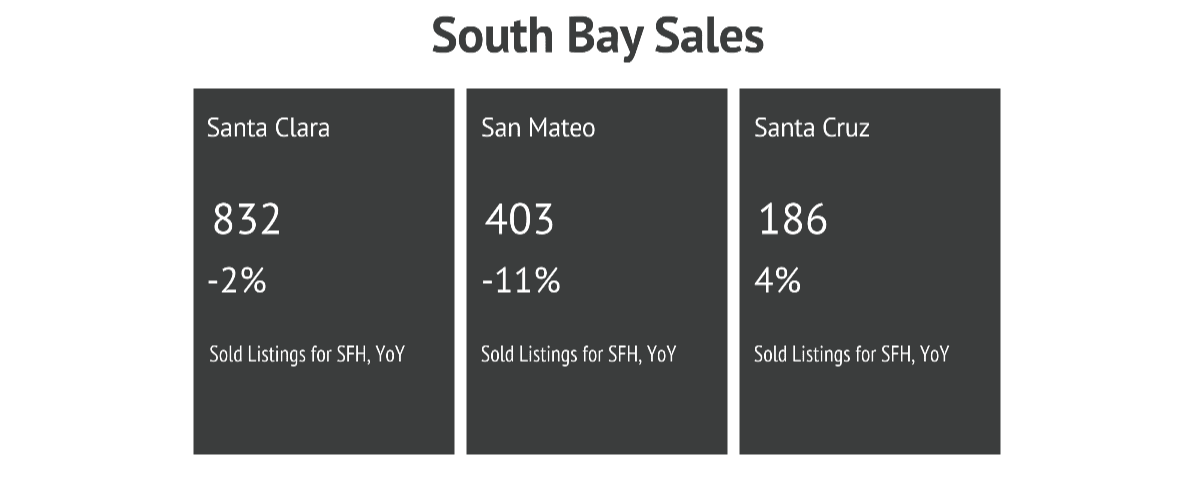
Sales measures how many homes are sold in a given month. For a seller, this number is driven by the level of demand and the number of buyers in the market. Very low or very high sales can influence how a seller prices their home. For example, very low sales, which equates to very low demand, might encourage sellers to price their homes more competitively.
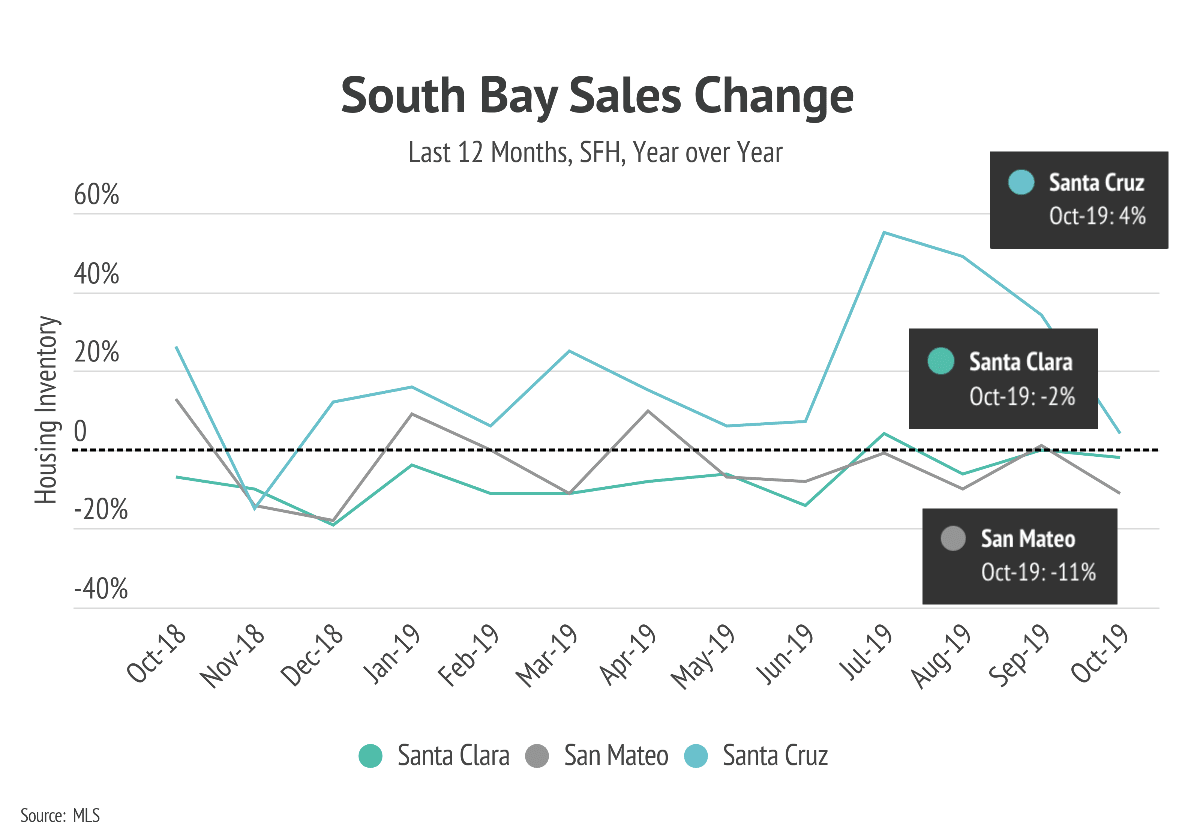
Sales in the South Bay counties trended slightly lower over the past year, with Santa Cruz as the exception. Again, these sales figures show relative stability heading into the winter months and should not significantly impact pricing.
Finally, we consider inventory.
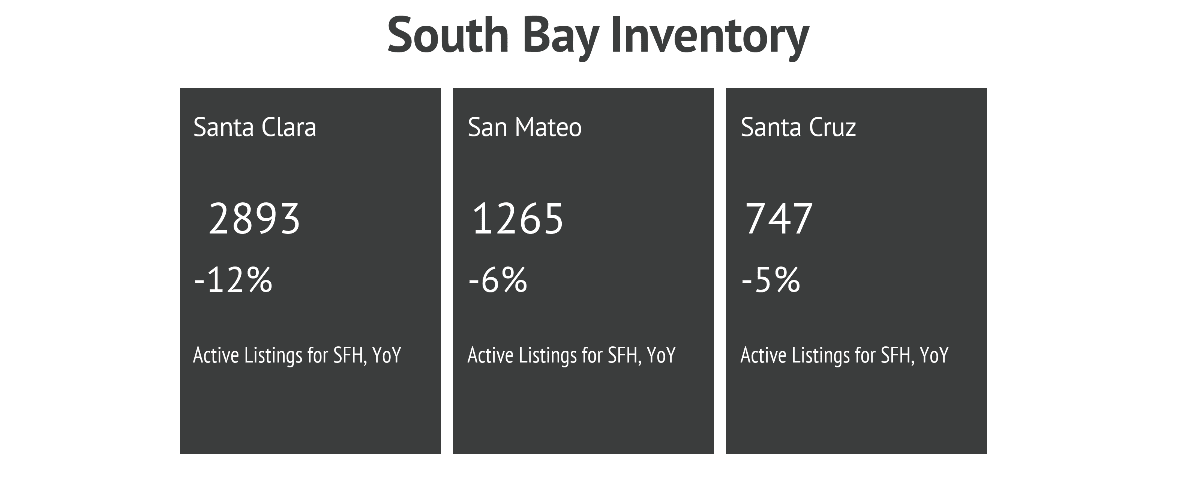
Inventory measures the number of homes listed for sale. For sellers, it’s an indication of how competitive the market is. For buyers, it measures how many options are available on the market. Very low or very high inventory can influence how a seller prices their home. For example, higher inventory levels mean that sellers have more competition, and potential buyers have more choices. In this scenario, a seller might price their home more competitively, while a buyer may come in with a lower bid, especially if they’ve seen lots of price reductions in the area.
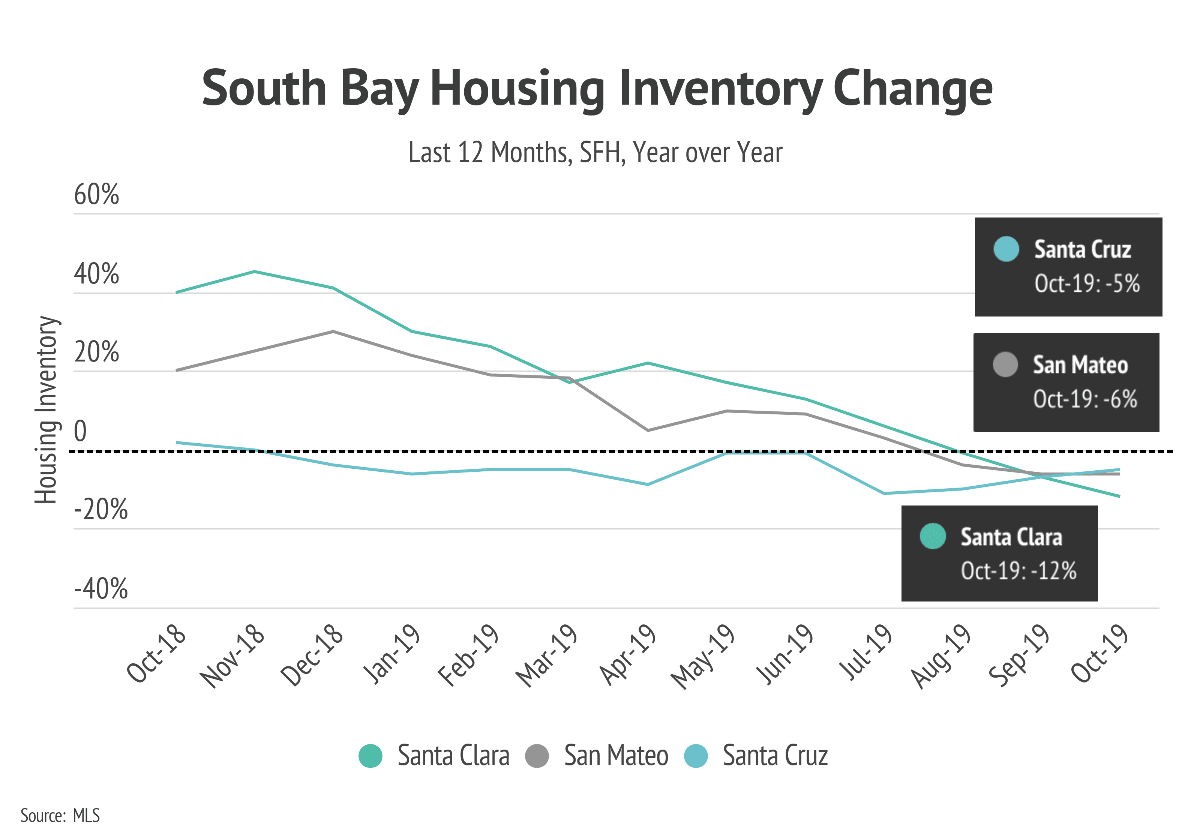
Inventory levels in the South Bay are lower than this time last year. In the winter months of this past year, inventory levels were up 40% in Santa Clara and over 30% in San Mateo. This market shift was significant enough to force sellers to price their homes more competitively. However, in the month of October, we are in a state of neutrality again. Overall, inventory levels are relatively stable heading into the winter months, so pricing is unlikely to change significantly.
Now that we’ve thought about home pricing based on the CMA and the two primary market trends (median home prices and supply), let’s shift our focus to days on market and the average sold price as compared to the original list price. We’ll see how understanding both of these factors can help sellers avoid the critical mistake of overpricing a home.
"*" indicates required fields
Stay Updated On Our Most Recent Blog Posts

Seller's Real Estate Tips
Brian Ng | October 4, 2026

Seller's Real Estate Tips
Brian Ng | September 28, 2026

Buyer's Real Estate Tips
Thao Dang Pham | September 4, 2026

Buyer's Real Estate Tips
Brian Ng | August 29, 2026

Buyer's Real Estate Tips
Brian Ng | August 3, 2026

Seller's Real Estate Tips
Brian Ng | July 30, 2026
You’ve got questions and we can’t wait to answer them.