Real Estate Investment Examples: San Jose Case Studies for Every Strategy
July 25, 2025
Real Estate

July 25, 2025
Real Estate
Real estate investing can take many forms—each with unique risks and rewards.
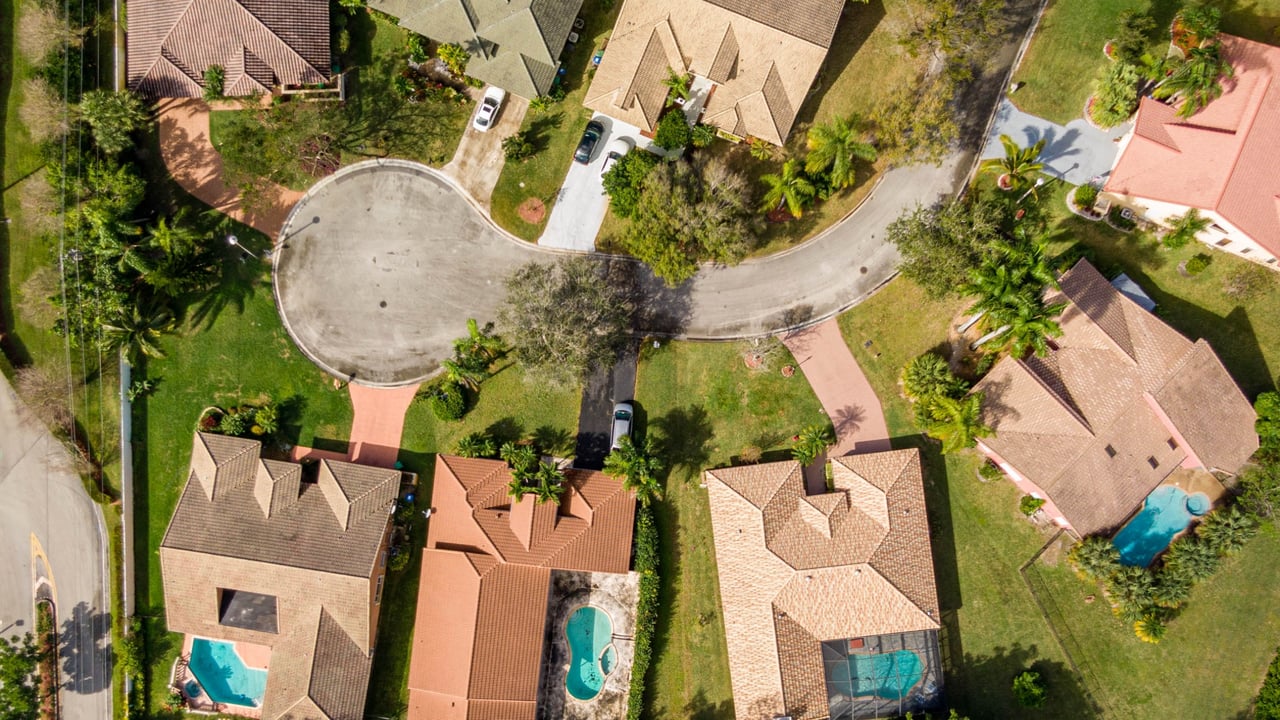
In competitive markets like San Jose, examining real-world examples helps beginners and seasoned investors alike understand what works. Below, we present five detailed case studies:
Single-Family Rental in Evergreen (95123)
Condo Flip in Silver Creek (95138)
Accessory Dwelling Unit (ADU) in Cambrian Park
Small Multi-Family Purchase near Downtown San Jose
REIT Investment focused on Bay Area offices
For each, we’ll cover purchase price, financing, renovation costs (if any), rental or sale income, expenses, and net returns. You’ll see specific numbers—down to budgeted repair costs and anticipated rents—so you can apply these lessons to your own San Jose investments.

Purchase Price: $1,480,000
Home Type: 3-bed, 2-bath single-family house
Down Payment: 25% ($370,000)
Loan: $1,110,000 at 5.5% → P&I $6,300/month
Monthly Rent: $4,800
Property Tax: 1.18% → $17,464/year → $1,455/month
Insurance: $1,200/year → $100/month
Maintenance Reserve: 5% of rent → $240/month
Property Management: 7% of rent → $336/month
Total Expenses: $6,431/month
Net Cash Flow: $4,800 – $6,431 = –$1,631/month
Negative Cash Flow covered by tax benefits and long-term appreciation.
Expected Appreciation: 3–5% annually.
Exit: Hold 7–10 years, refinance once equity hits 25% and rates drop, then acquire next rental.
Lesson: In high-cost markets, expect modest negative cash flow; rely on appreciation and leverage.
Purchase Price: $1,270,000
Property: 2-bed, 2-bath condo, 1,200 sq ft
Down Payment: 30% ($381,000)
Loan: $889,000 at 5.75% → P&I $5,180/month
Cosmetic Upgrades: Paint, flooring, lighting — $20,000
Kitchen/Bath Refresh: Cabinets, countertops, fixtures — $40,000
Staging & Landscaping: $5,000
Total Reno Cost: $65,000
After-Reno Sale Price: $1,450,000
Gross Profit: $1,450,000 – $1,270,000 – $65,000 = $115,000
Closing & Sales Costs (6%): $87,000
Net Profit: $115,000 – $87,000 = $28,000
ROI: $28,000 / $446,000 cash (down + reno) = 6.3% over 6 months
Lesson: Flips in stable condo markets yield modest returns; scale by volume or target undervalued submarkets.
Purchase Price: $1,420,000 (3-bed SFR on 8,000 sq ft lot)
Down Payment: 25% ($355,000)
Loan: $1,065,000 at 5.25% → P&I $5,850/month
Permitting & Construction: $180,000
Size: 600 sq ft studio
Rental Income: $2,300/month
Main House Rent: $4,200
ADU Rent: $2,300
Total Rent: $6,500
Monthly Expenses:
P&I: $5,850
Tax & Insurance: $1,400
Maintenance: $325 (5% of main rent + ADU)
Management (7%): $455
Total: $8,030
Net Cash Flow: $6,500 – $8,030 = –$1,530/month
Equity Build: Both units appreciate; ADU boosts resale value by $75K+
Future Refinance: After 2 years, refinance to cash out ADU equity for next investment
Lesson: ADUs widen negative cash flow but accelerate equity accumulation; use strategically where lots allow.
Purchase Price: $2,500,000
Property: 4-unit building (2×2-bed, 2×1-bed)
Down Payment: 30% ($750,000)
Loan: $1,750,000 at 5.75% → P&I $10,150/month
| Unit Type | Rent | Total |
|---|---|---|
| 2-bed | $3,800×2 = $7,600 | |
| 1-bed | $2,600×2 = $5,200 | |
| Gross Rent | $12,800 |
Expenses:
Property Tax: $29,500/year → $2,458/month
Insurance: $2,400/year → $200/month
Maintenance (5%): $640
Management (7%): $896
Total Expenses: $16,204
Net Cash Flow: $12,800 – $16,204 = –$3,404/month
Annual Net: –$40,848
Appreciation: 4% → $100K/year equity gain
Stabilization: After rent bumps and expense reduction, target break-even by year 3
Lesson: Multi-family in core locations may run negative cash flow early; long-term equity and forced appreciation via rent increases drive returns.
REIT ETF (VNQ): 40% of REIT allocation
Digital Realty Trust (DLR): 30% (data centers near Cupertino)
Equity Residential (EQR): 30% (residential REIT with Bay Area properties)
Initial Investment: $100,000
Dividend Yield (Avg): 4.5% → $4,500/year
Total Return (5-year avg): 8–10% annually including price gains
Dividend Tax: Ordinary rates but 199A deduction applies
Liquidity: Buy/sell any trading day; no maintenance worries
Lesson: REITs complement direct investments; ideal for small capital and immediate diversification.
These real estate investment examples illustrate how diverse strategies—single-family rentals, condo flips, ADUs, multi-family buys, and REITs—play out in San Jose’s market. Each approach requires balancing cash flow, appreciation, and risk:
Rentals & ADUs lean on appreciation and equity build.
Flips deliver quick but modest profits.
Multi-family offers scale at the cost of negative early cash flow.
REITs grant easy, passive market exposure.
By studying real numbers—purchase prices, financing, renovation budgets, rents, and expenses—you can choose the strategy that matches your capital, time horizon, and risk appetite.
Block Change Real Estate combines hyperlocal expertise with these proven models to guide your path. Ready to apply these examples to your first or next investment? Let’s build your portfolio together.
Stay Updated On Our Most Recent Blog Posts
Buyer's Real Estate Tips
Brian Ng | July 7, 2026
Buyer's Real Estate Tips
Brian Ng | June 30, 2026
Buyer's Real Estate Tips
Thao Dang Pham | June 19, 2026

Buyer's Real Estate Tips
Thao Dang Pham | June 10, 2026

Buyer's Real Estate Tips
Brian Ng | May 28, 2026
Real Estate
Brian Ng | May 5, 2026
You’ve got questions and we can’t wait to answer them.
